
How We Turned a 60% Reappointment Rate into 95% — The Accountability Structure
Aug 10, 2026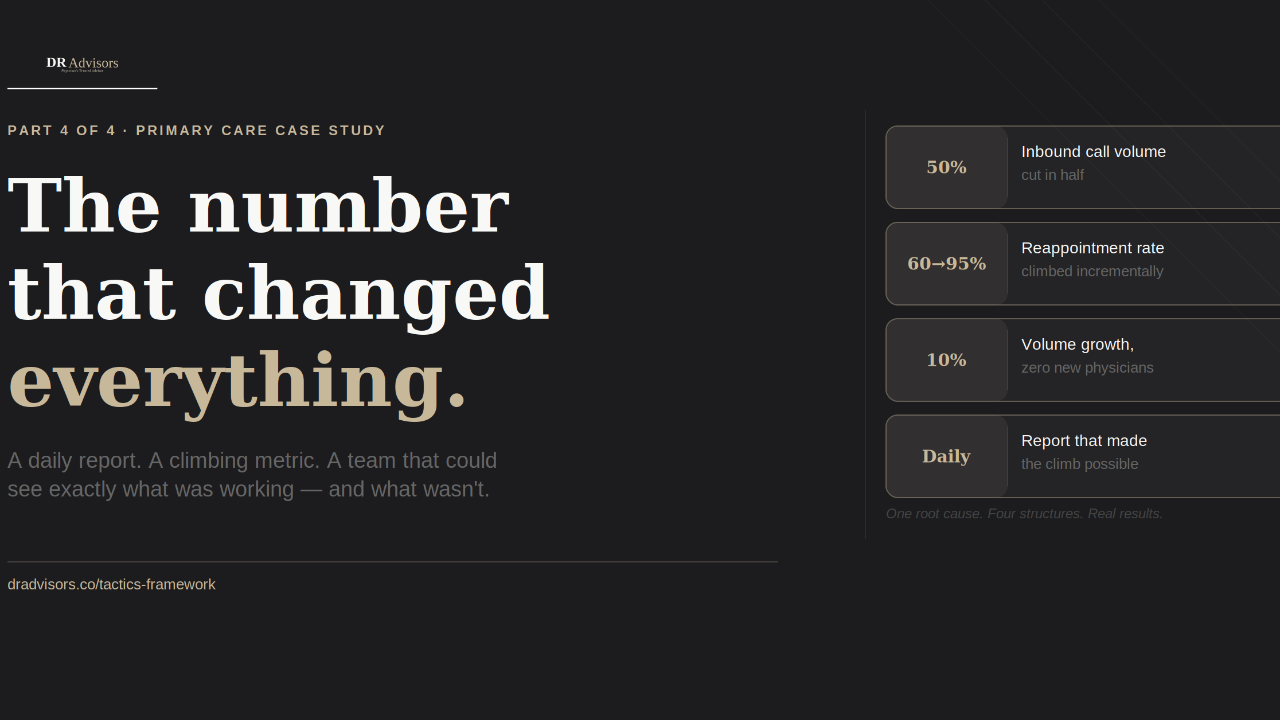
Part 4 of 4 — Primary Care Case Study: Accountability Structure
Where most change programs die
By the time we had completed the work in Parts 1 through 3 of this series, the foundation was in place.
- The Physician Operator Review had surfaced the root cause.
- The staff were bought in and ownership was assigned.
- The process gaps — the missing handoff from physician to checkout, the patients bypassing the desk entirely — had been identified and fixed.
- The reappointment rate was at 70%.
That's the moment most change programs quietly stop. The initial energy is spent. The obvious problems have been solved. And the number isn't where it needs to be yet — but nobody is checking it closely enough to see why, or where the remaining 30% is still leaking out. The accountability structure is what keeps the program alive past that point.
Building the report
The first thing we built was a daily and weekly reappointment rate report. Not a monthly metric buried in a dashboard — a report visible every single day that showed exactly where the number stood, which patients had not been rebooked, and where in the process the gap was occurring.
This was the critical design decision.
Monthly reporting tells you something went wrong thirty days ago. Weekly reporting tells you something went wrong last week. Daily reporting tells you something went wrong yesterday — which means you can fix it today.
A patient who wasn't rebooked on Monday appeared in the report on Tuesday morning. The team made the call Tuesday afternoon. The appointment was on the books by Tuesday evening. The problem didn't compound into a refill call, a scheduling crisis, or a frustrated physician six weeks later. It was caught in the gap and closed before it became anything larger.
The report also gave management the specificity to diagnose where the remaining gaps were. At 70%, something was still breaking down — but what? The daily data showed it wasn't random. It was clustered in specific situations: certain physicians whose checkout handoff wasn't working consistently, certain times of day when the checkout desk was too busy to complete the rebook, certain patient types who were bypassing the step.
Each cluster was a solvable problem. The report made the clusters visible.
The climb
The reappointment rate moved in increments. 70% to 75% when the handoff documentation became consistent across all physicians. 75% to 80% when the bypass issue was fully closed. 80% to 85% when the staffing model at checkout was adjusted to handle end-of-day volume. 85% to 95% as the remaining edge cases were identified and resolved one by one.
Each plateau was a signal. When the rate stalled, the report told us where to look. We brought the specific data to the team — not as a performance conversation, but as a diagnostic one. What are you seeing at this time of day? What's happening with this physician's checkout flow? What's the patient doing differently in these cases?
The team's answers combined with the data to identify the next fix. That combination — quantitative data plus qualitative team input — is what made the climb possible. Data alone tells you the rate isn't moving. The team tells you why. Together they tell you what to fix next.
What accountability actually means
Accountability in this program wasn't about consequences for staff who didn't hit the number. It was about visibility — making the metric real, present, and impossible to ignore at every level of the organization. The front desk team could see the daily report. They knew what the number was and whether the process was working.
When it was below 95%, they worked the outreach list — calling patients back and getting them scheduled at the right intervals. The feedback between their behavior and the result was fast enough to make the connection clear. The manager saw it weekly. Problems that showed up in the daily data were addressed before they became trends.
Coaching conversations were specific — not "rebook rates need to improve" but "these three patients from Tuesday weren't rebooked and here's what happened in each case." The physicians saw it monthly in the Operator Review. The same meeting that surfaced the root cause was now tracking the fix to completion. Physicians could see the number climbing. They understood why.
And they trusted that the organization was following through — which sustained their engagement in the program over the months it took to reach 95%.
The full result
Here is what the complete program produced across all four structures:
- 50% reduction in inbound call volume — the phone crisis that looked like a staffing problem
- 60% to 95% reappointment rate — incrementally, one process barrier at a time
- 10% volume growth — zero new physicians added to the group
One root cause.
Four structures.
A report checked every day.
A number that climbed until it didn't need to climb anymore.
This is what the TACTICS Framework is designed to produce — not a consulting report that identifies problems, but a working system that finds them, fixes them, and tracks them to resolution.
In this practice, the system worked because all four structures ran simultaneously: the Physician Operator Review surfaced the diagnosis, staff engagement created the behavior change, the process review removed the structural barriers, and the accountability structure kept everything visible until the work was done.
None of this required a new hire. It didn't require a technology platform.
It required the right meeting structure, the right team conversations, the right workflow design, and a number that someone checked every single day.
If your practice has a problem that's been diagnosed but not fixed — or a fix that worked for a while and then faded — the TACTICS Framework is built for exactly that. Book a free strategy call now!